TECLA developed software for the analysis of astrophysical data. Specifically, TECLA provides tools for astrophysical data analysis in four different areas:
- Tools for the analyses of supernovae remnants images. Starting from X-emission spectra of different SNRs we can cosntruct dendrograms whose leaves represent the different elements of continuum parts of each SNRs. According to the leaves sequence in the dendrogram one can assess what are the SNRs with highest similarity.
- Tools for the detection of changepoints in the lightcurves. Our tool allows to distinguish the different regions of the lightcurve characterized by homogeneous statistical properties.
- Tools for the lightcurve cleaning with Deep learning methods. The analysis of cosmic background emission signals is often flared by the contamination effects due to solar flares. Our tool allows for the discrimitation between genuone astrophysical signal from noise due to solar flares. This is obtained with deep learning based tools.
- Tools for the lightcurve cleaning with statistical methods. The analysis of cosmic background emission signals is often flared by the contamination effects due to solar flares. Our tool allows for the discrimination between genuine astrophysical signal from noise due to solar flares. This is obtained with tools leverage on the statistical properties of the different lightcurve regions.
In this section we provide a git environment where our codes are made available to the scholars community
- SNRsClust
- Fast Changepoints
- Stat Photon Cleaner (SPC)
- Deep Photon Cleaner (DPC)
SNRsClust
TECLA developed codes for the analysis of SNRs with the aim of assessing the level of similarity amongst SNRs.
We start by considering X-emission spectra of different SNRs. These are sliced in order to isolate the continuum part(s) and those relative to the different chemical elements observed in the SNRs.
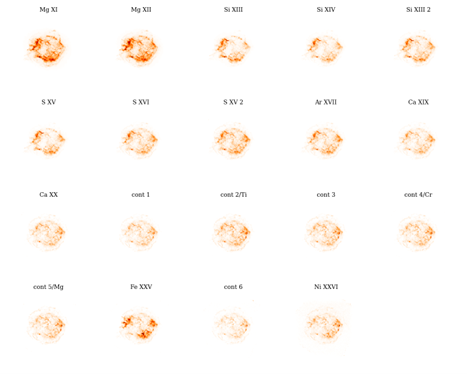
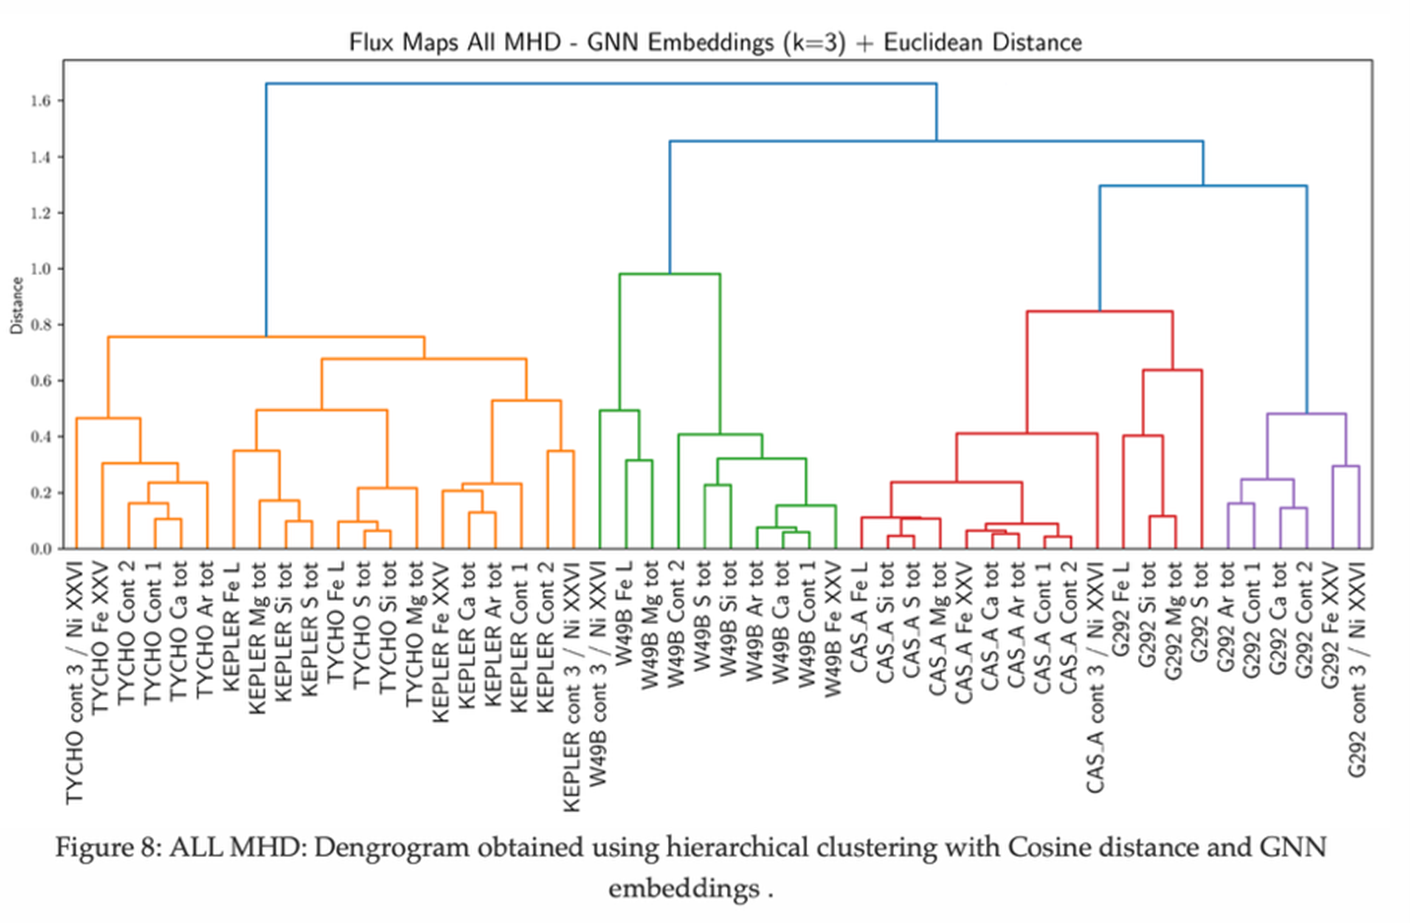
The output of our analyses will be a dendrogram whose leaves represent the different elements of continuum parts of each SNRs.
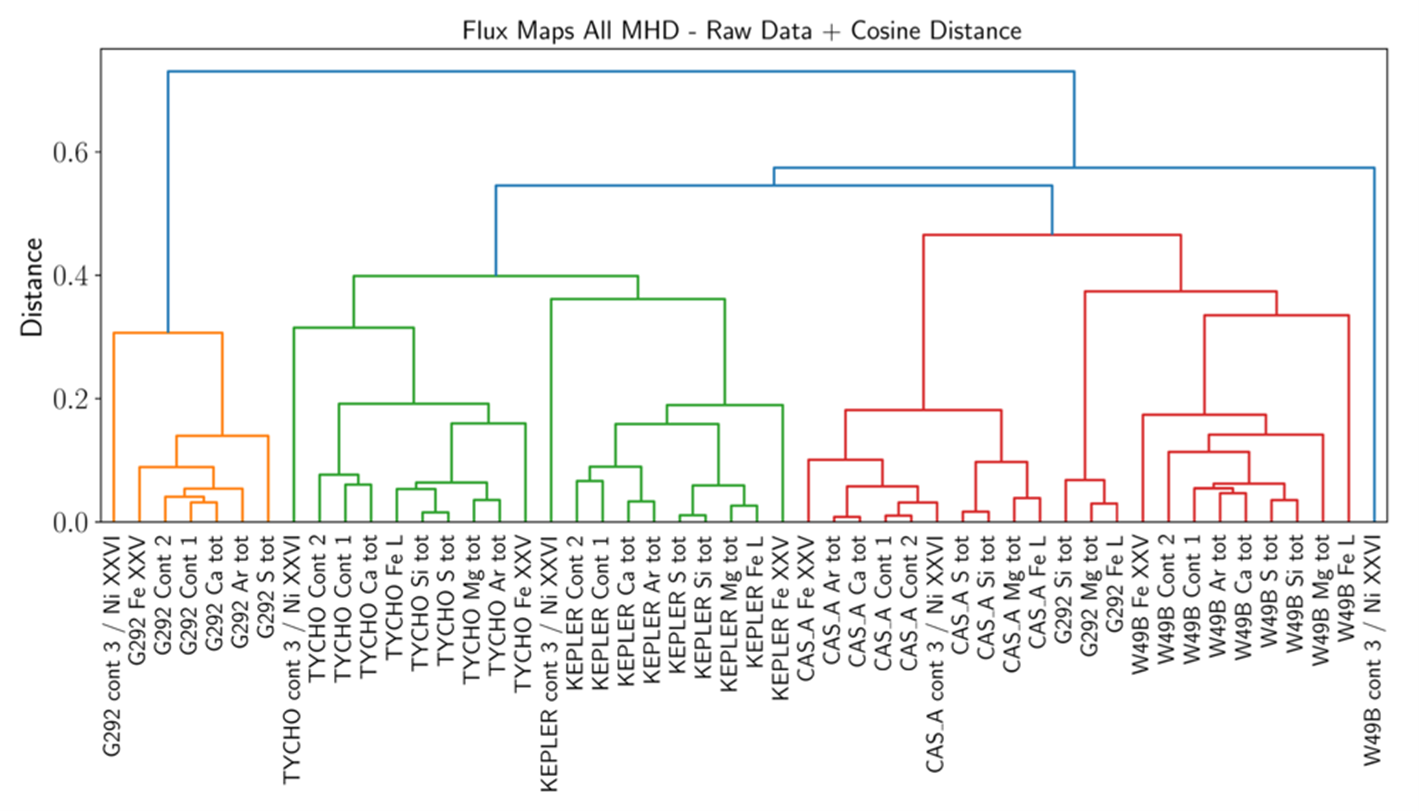
According to the leaves sequence in the dendrogram one can assess what are the SNRs with highest similarity.
The codes developed within TECLA allow for three different analyses:
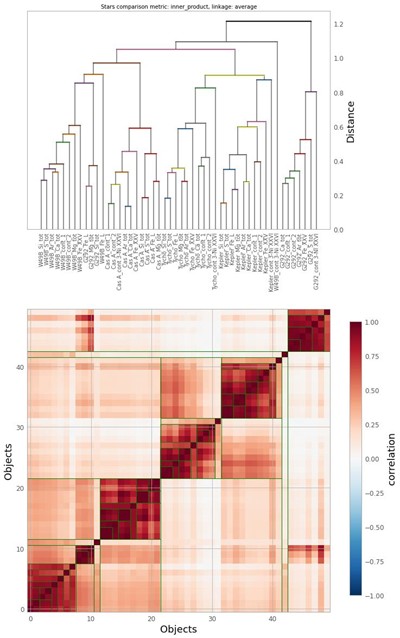
- The similarity among SNRs continuum parts and spectra is computed according to the Frobenius distance between the 2-D images relative to such elements. The SVHC methodology is used to obtain a statistically validated dendrogram where each clade is associated to a p-value. According to the p-value one can assess whether the cluster associated to the elements below the clade is statistically significant or not.
- The similarity among SNRs continuum parts and spectra is computed according to the cosine distance between the vectors associated to the 2-D images relative to such elements. Standard Average Linkage hierarchical clustering techniques are used to generate the dendrogram.
- The similarity among SNRs continuum parts and spectra is assessed by computing a network where links are set on the basis of the features shared by each node and its first K neighbours.
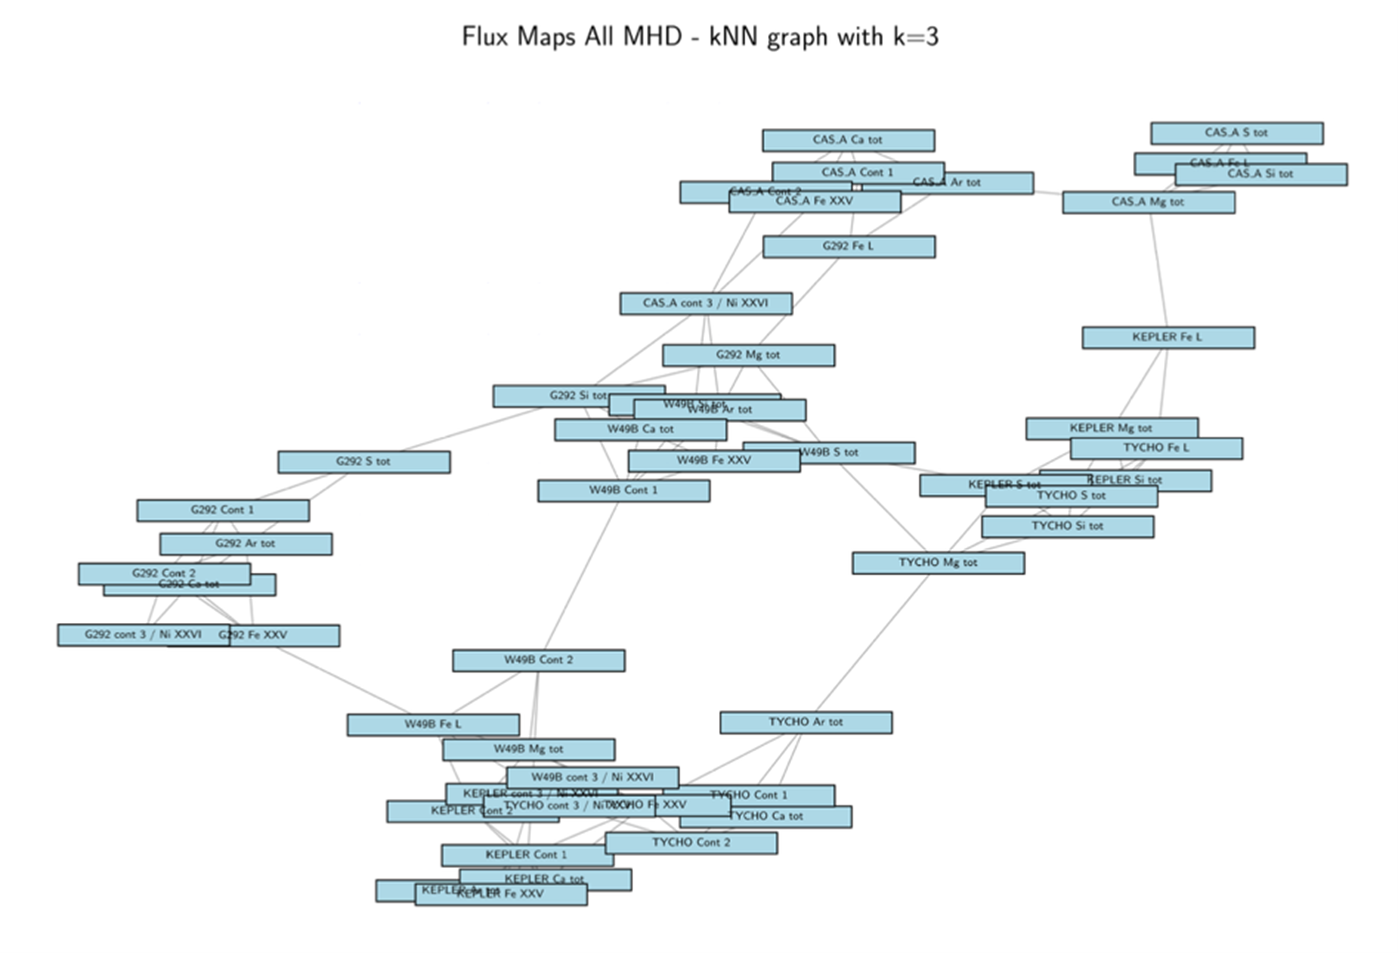
A dendrogram is then constructed by using standard agglomerative procedures, where nodes are joined together to form a supernode according to their similarity.
Fast Changepoints
The analysis of cosmic background emission signals provides crucial insights into the evolution and structure of the Universe. However, solar flares often contaminate these observations. These highly energetic phenomena produce intense fluxes of photons and charged particles that interfere with cosmic-ray measurements. Removing such disturbances is essential to reconstruct astrophysical signals accurately. Traditional methods, such as XMM-SAS, face a significant limitation: they often discard large portions of data during cleaning. In doing so, they usually eliminate not only the contaminated components but also substantial parts of the genuine cosmic signal. This loss can remove scientifically valuable information, especially in low-intensity observations or within sensitive energy bands.
To overcome these limitations, TECLA developed two more conservative methodologies that clean the signal while minimizing the loss of relevant data. In both approaches we start by considering a Glow Curve (luminosity curve).
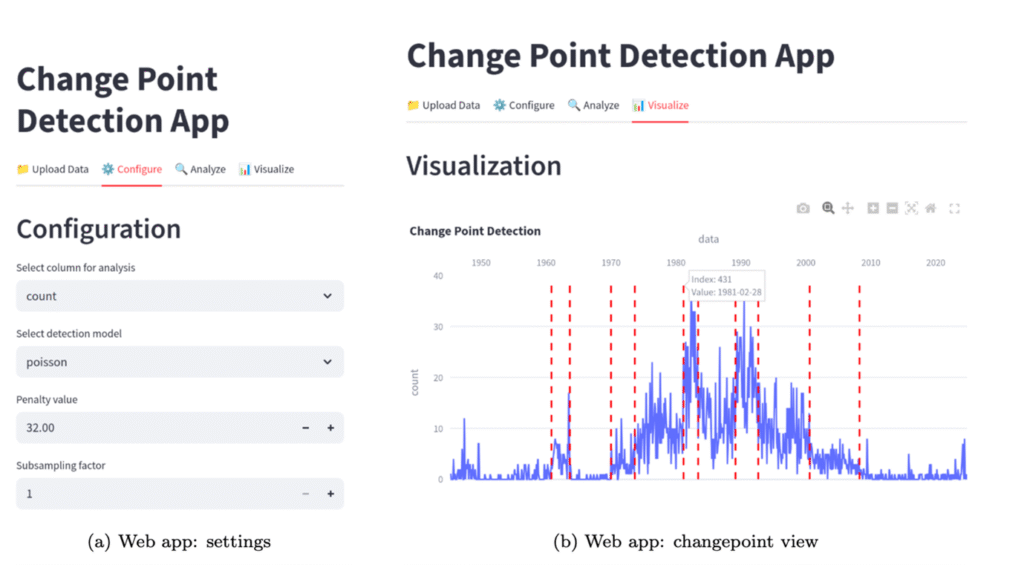
A preliminary investigation is that of identifying abrupt changes in their statistical properties. In the language of time series analysis, these points are called change points, and detecting them is a crucial step in understanding the underlying dynamics of the data.
Many algorithms exist for change point detection [6]: in the case of offline change points detection the optimal approach is given by the Pruned Exact Linear Time (PELT) algorithm [7], which is able to find the optimal segmentation of a time series in linear time, given a cost function and a penalty for adding more change points. The algorithm is very flexible, as it allows for different choices of cost functions; moreover, it’s very efficient (linear time complexity), making it suitable for large datasets.
A webapp was developed for explorative analysis of change points using this method: an example is shown below.
Stat Photon Cleaner (SPC)
 The analysis of cosmic background emission signals provides crucial insights into the evolution and structure of the Universe. However, solar flares often contaminate these observations. These highly energetic phenomena produce intense fluxes of photons and charged particles that interfere with cosmic-ray measurements. Removing such disturbances is essential to reconstruct astrophysical signals accurately. Traditional methods, such as XMM-SAS, face a significant limitation: they often discard large portions of data during cleaning. In doing so, they usually eliminate not only the contaminated components but also substantial parts of the genuine cosmic signal. This loss can remove scientifically valuable information, especially in low-intensity observations or within sensitive energy bands.
To overcome these limitations, TECLA developed two more conservative methodologies that clean the signal while minimizing the loss of relevant data. In both approaches we start by considering a Glow Curve (luminosity curve).
The second methodolgy we developed, StatPhotonCleaner (SPC), is a statistical tool for removing solar flare contamination from cosmic background emission signals.
We start by considering the glow curve obtsained by using traditional cleaniong methods, such as XMM-SAS. Wwe consider the largest portion of this curve made of consecutive bins.
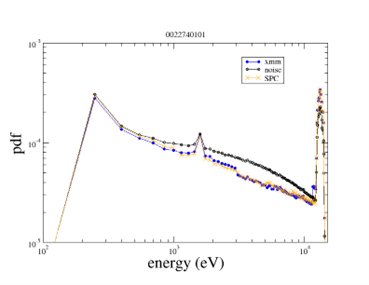
We use the identified reference portion of the signal (the "good part") to compute several key statistical features that characterize the typical behavior of the system in regions minimally affected by contamination. Specifically, we compute the median photon count and the standard deviation of the photon count across the bins within this reference segment, providing measures of central tendency and variability of the detected events. Additionally, we extracted temporal and energetic features from the photon events themselves: the median inter-photon arrival time and the energy spectrum. These reference values serve as benchmarks for further analysis, enabling the identification of anomalous or contaminated regions of the signal and providing a robust baseline for downstream processing or modeling.
Finally, for each noisy bin, we apply the following cleaning procedure. The procedure describes below applies to case when the astrophysical observation is large enough (> 106 records).
We first compute the wanted number of photons in each temporal bin of the glow curve according to the median photon count in the good part. In each temporal bin we select randomly such number of photons starting from those of the original glowcurve. We make such random selection trying to reproduce the energy spectrum of the good part. The energy spectrum
Deep Photon Cleaner (DPC)
The analysis of cosmic background emission signals provides crucial insights into the evolution and structure of the Universe. However, solar flares often contaminate these observations. These highly energetic phenomena produce intense fluxes of photons and charged particles that interfere with cosmic-ray measurements. Removing such disturbances is essential to reconstruct astrophysical signals accurately. Traditional methods, such as XMM-SAS, face a significant limitation: they often discard large portions of data during cleaning. In doing so, they usually eliminate not only the contaminated components but also substantial parts of the genuine cosmic signal. This loss can remove scientifically valuable information, especially in low-intensity observations or within sensitive energy bands.
To overcome these limitations, TECLA developed two more conservative methodologies that clean the signal while minimizing the loss of relevant data. In both approaches we start by considering a Glow Curve (luminosity curve).
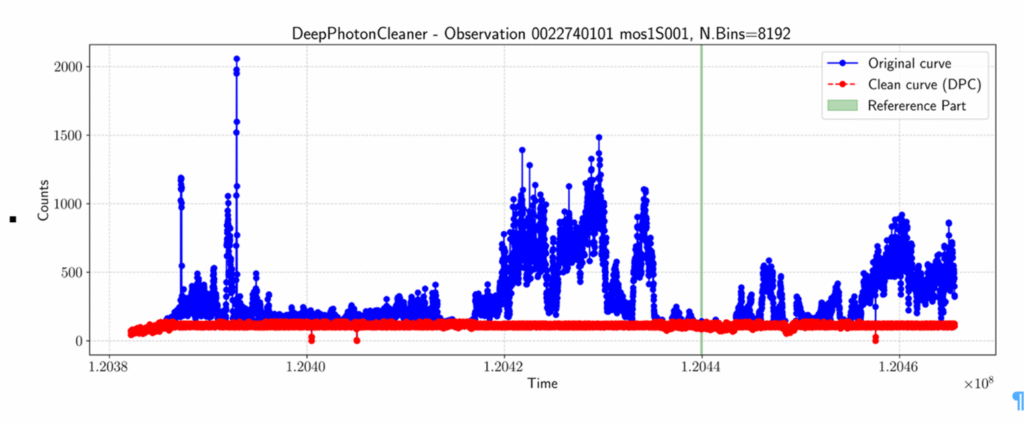
The first methodolgy we developed, DeepPhotonCleaner (DPC), is a deep learning tool for removing solar flare contamination from cosmic background emission signals.
DPC employs an Autoencoder to identify portions of the signal unaffected by solar flares. It then uses these clean segments to guide the subsequent cleaning procedure, ensuring the preservation of genuine astrophysical information while selectively removing the contaminated components.
We use the identified reference portion of the signal (the "good part") to compute several key statistical features that characterize the typical behavior of the system in regions minimally affected by contamination. Specifically, we compute the median photon count and the standard deviation of the photon count across the bins within this reference segment, providing measures of central tendency and variability of the detected events. Additionally, we extracted temporal and energetic features from the photon events themselves: the median inter-photon time was computed to characterize the typical spacing between successive detections, while the median photon energies were separately determined for low-energy (500–2000 eV) and high-energy (2000–10000 eV) ranges to capture the characteristic energy distribution of the photons in the stable segment. These reference values serve as benchmarks for further analysis, enabling the identification of anomalous or contaminated regions of the signal and providing a robust baseline for downstream processing or modeling.
Finally, for each noisy bin, we apply the following cleaning procedure. First, a target photon count is determined by sampling from a uniform distribution within the range defined by one standard deviation below and above the mean photon count of the reference (good) bins. Next, the individual photons within the bin were ranked according to their similarity to the target characteristics, based on a combination of temporal and energy criteria:
- Temporal Scoring: the inter-arrival times of photons were computed, and each photon was assigned a temporal score inversely proportional to its deviation from the target time. Photons closer to the target time received higher scores.
- Energy Scoring: photons with energies within the reference energy range were assigned an energy score of 1, while all others received 0. This ensures that photons consistent with the expected spectral signature are prioritized.
- Contamination Penalty: photons with energies in a predefined contamination range (e.g., 4000–10000 eV, typical of solar flare events) were penalized to reduce their overall score.
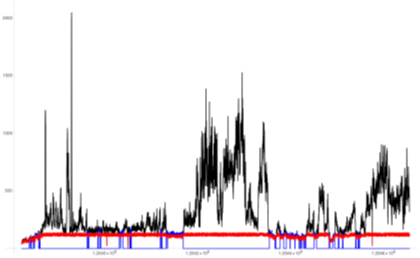
The combined score, calculated as a weighted sum of temporal and energy scores plus the contamination penalty, was then normalized to the [0,1] range. Photons are ranked according to this normalized score, and the top l photons with the highest scores were retained. All remaining photons were considered potentially contaminated and flagged accordingly. A result of a glow curve cleaned with this procedure is shown below.